NCIA Accountability Metrics
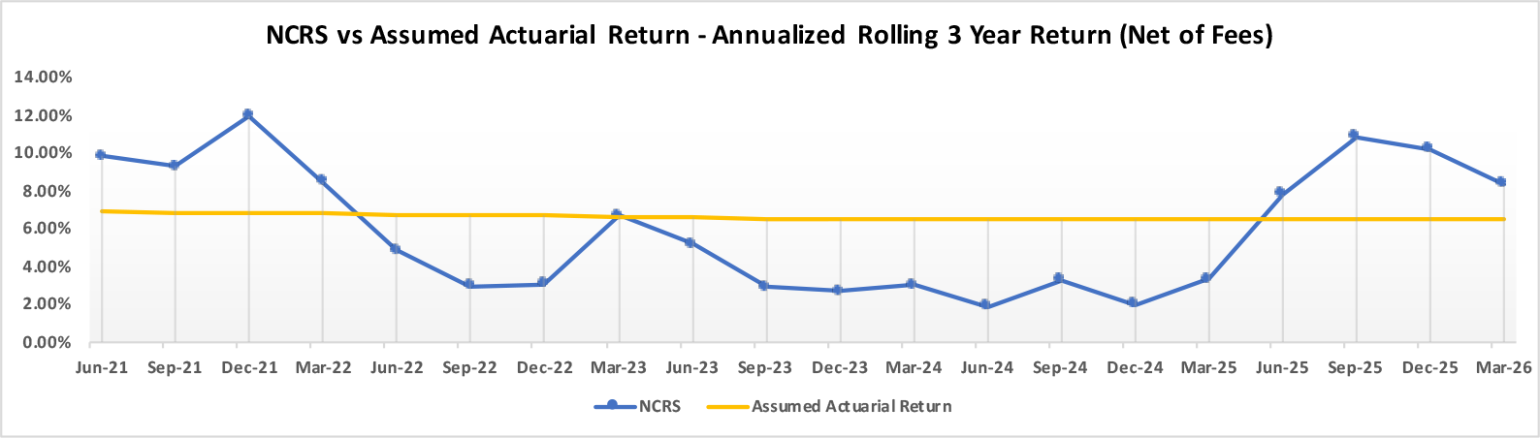
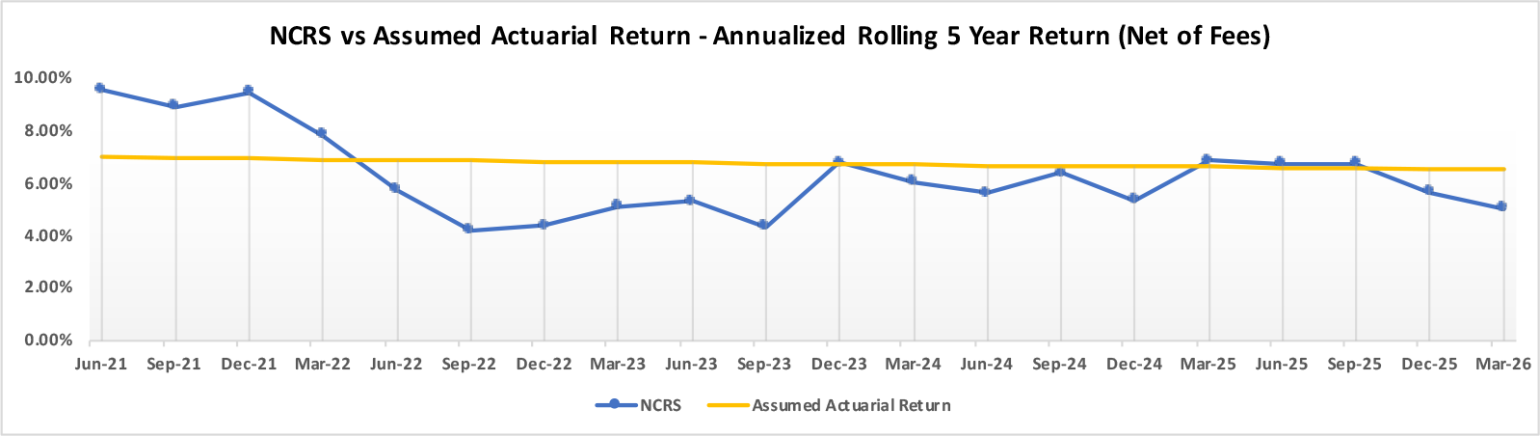
Assumed Actuarial Returns
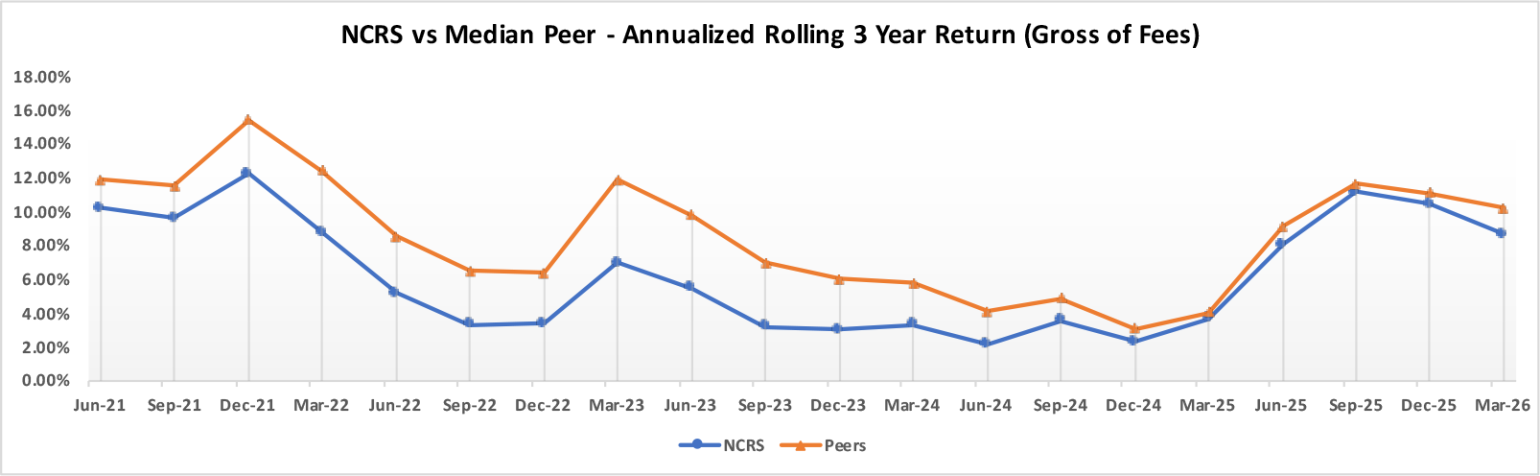
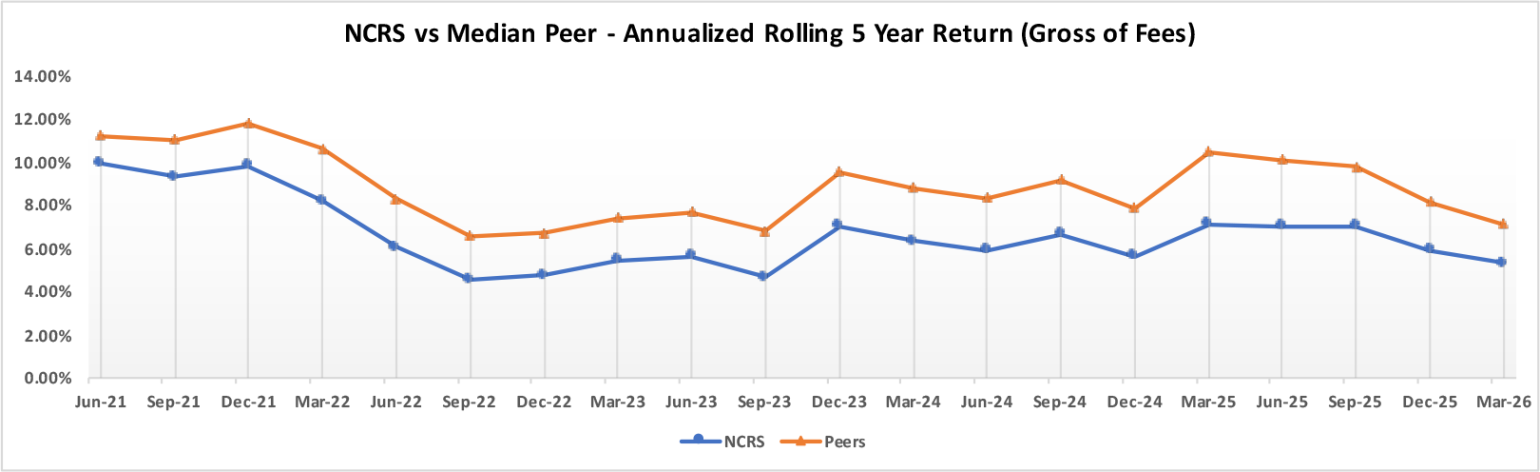
Peer Comparison
Implementation Benchmarks
Note 1: Peer Group Universe is the BNY Universe of US Public Funds > $20B
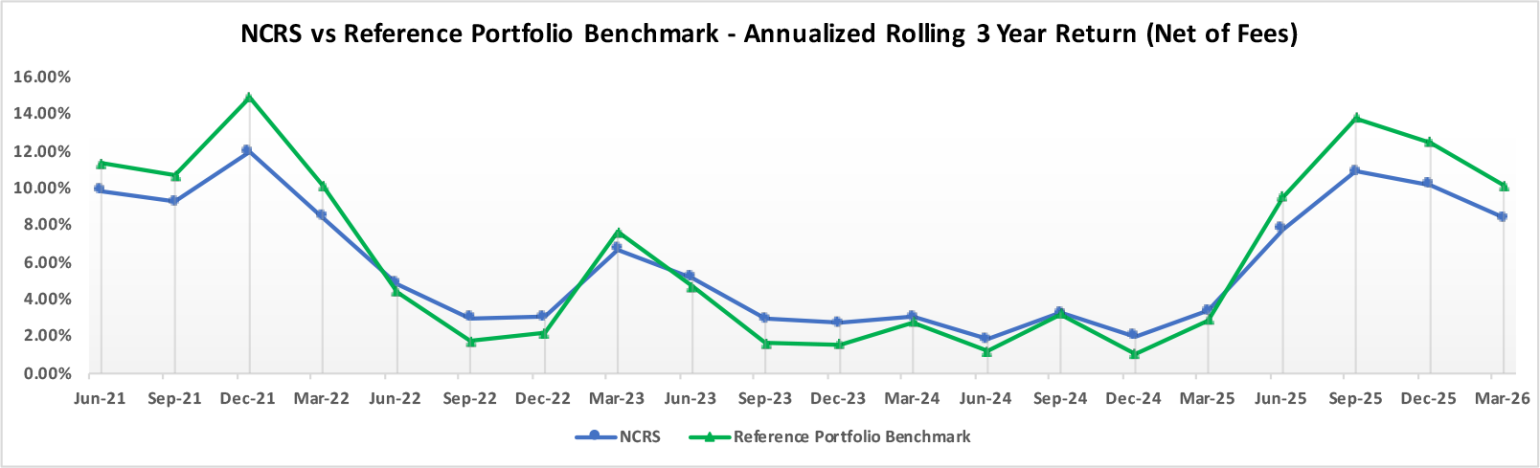
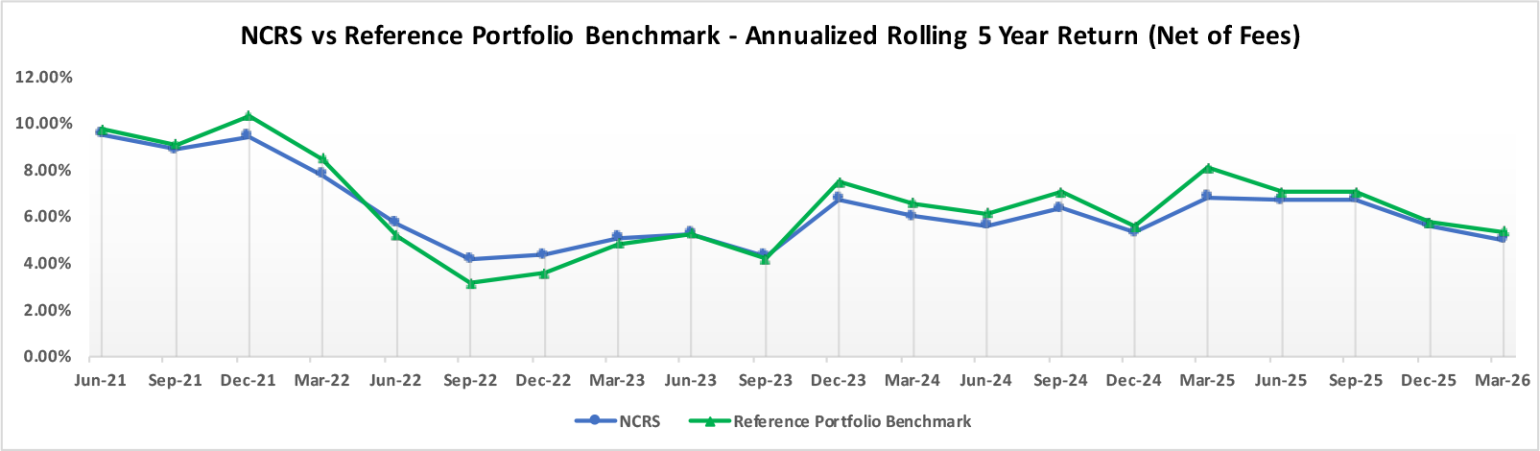
Note 2: The Reference Portfolio Benchmark is comprised of 65% MSCI ACW IMI Net and 35% ICE BofA 5+ Years U.S. Treasury Index starting in March 2026. The structure of this benchmark has changed over time as the investment policy has changed, the returns reflect the historical structure that was in place at each point in time. The latest prior structure was comprised of 57% MSCI ACWI IMI Net, 33% ICE BofA 5+ Years U.S. Treasury Index, 6% Bloomberg Commodity Index, and 4% ICE BofA 1-3 Years U.S. Inflation-Linked Treasury Index.